Today i want to share my way how i monitor my Mosquitto MQTT Broker.

Used Tools:
– Mosquitto
-Node-Red
-InfluxDB
-Grafana
The change function:

What topic is for what: https://mosquitto.org/man/mosquitto-8.html


The Output of this function i forward direct in a influxdb object:

This results in a new measurement table in influx:
1612301513903060473 publishmessagesreceived 3673357
1612301513903536179 messagesreceived 4021280
1612301513903986660 bytessent 737942819
1612301513904438741 bytesreceived 855373047
1612301513904867547 publishmessagessent 3702965
1612301513905292203 publishbytessent 612137624
1612301513905668245 publishbytesreceived 744766929
1612301513906041838 loadbytessent5min 429681.23
1612301513906428743 messagessent 4043448
1612301524896645319 loadmessagesreceived1min 2117.19
1612301524897729721 loadpublishsent1min 3093.27
1612301524897729858 loadpublishreceived1min 2030.89
1612301524897807172 loadbytesreceived1min 487152.21
1612301524898050025 loadbytessent1min 613414.4
1612301524898066763 loadmessagessent1min 3176.61
1612301524898383254 loadsockets1min 1.9
1612301524918005693 loadconnections1min 1.9
1612301524918417461 loadpublishsent5min 2185.47
1612301524918807241 loadpublishreceived5min 1542.26
1612301524919121232 loadmessagessent5min 2373.57
1612301524919451424 loadmessagesreceived5min 1733.53
1612301524919749216 storemessagesbytes 6020
1612301524920027032 storemessagescount 88
1612301524920159846 messagesstored 88
1612301524920458488 loadconnections15min 1.13
1612301524920612252 loadsockets15min 1.13
1612301524920903319 loadbytessent15min 269440.39
1612301524921056546 loadbytesreceived15min 233154.23
1612301524921124734 loadpublishreceived15min 1003.03
1612301524921171072 loadpublishsent15min 1341.78
1612301524921282899 loadmessagessent15min 1551.73
1612301524921623641 loadmessagesreceived15min 1215.22
1612301524921654391 loadsockets5min 1.9
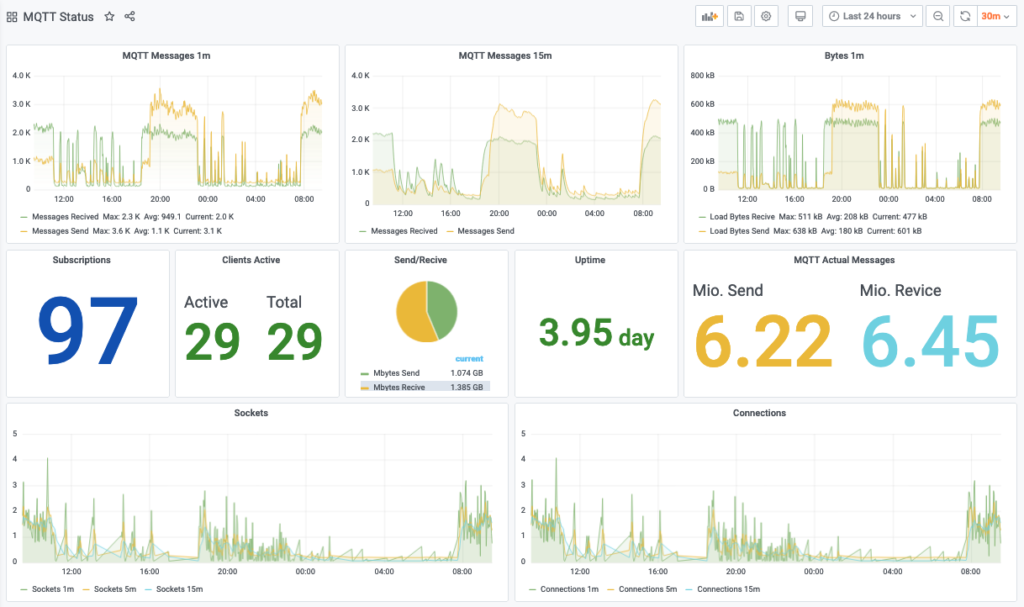
The Result in my Grafana Dashboard:
If you´ve questions or want to comment on one of my project please contact me on twitter: https://twitter.com/jarodw79